Objectives:
(1) To determine how age, weight, sex, fatness and muscling affect the value of livestock.
(2) To show why some breeds of livestock have different abilities to deposit fat.
(3) To relate actual present-day market conditions that are due to the relative merit of livestock.
Appraisal of market animals — knowledge necessary to evaluate market animals (relative merit and market situation).
- Age
- Weight
- Sex
- Fatness
- Muscling
Factors affecting Relative Merit
Age
As animals increase in age, they are likely to become:
- Less tender
- More flavorful
- Darker in lean color
- Yellow in fat color
- Diseased
- Fatter
Not all species are affected equally
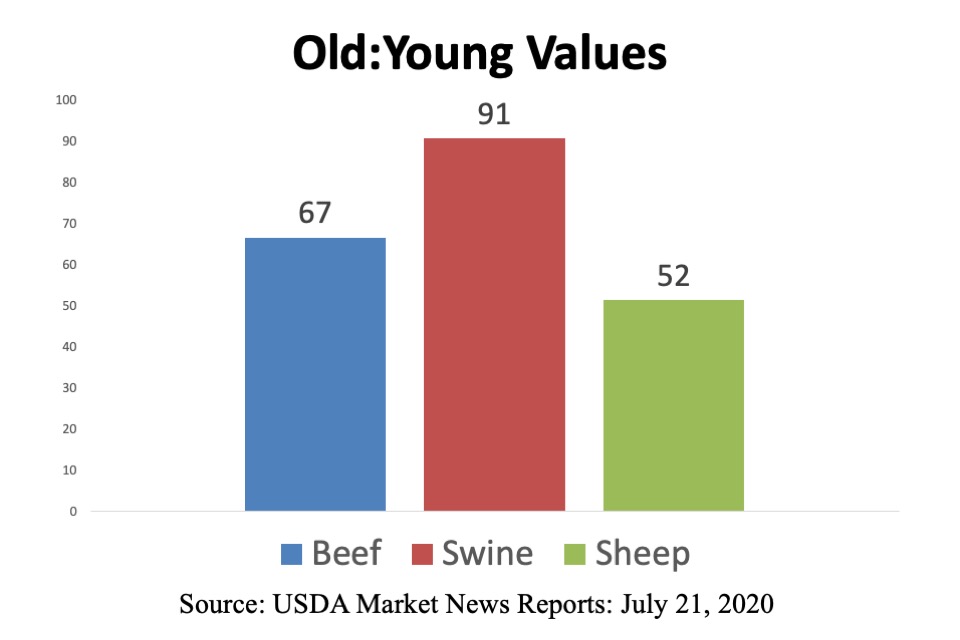
Comparative effects of age on market value by species (old:young ratio)
 Why?
Why?
Beef
- Less tender
- More intense flavor
- Darker lean color
- Yellow fat color
Swine
- Fatter
Sheep
- Undesirable flavor
- Condemnation rate due to higher incidence of disease
In summary, swine are the least impacted species of meat animals, while sheep are the most impacted with respect the the negative effects of increasing age on the value of older animals.
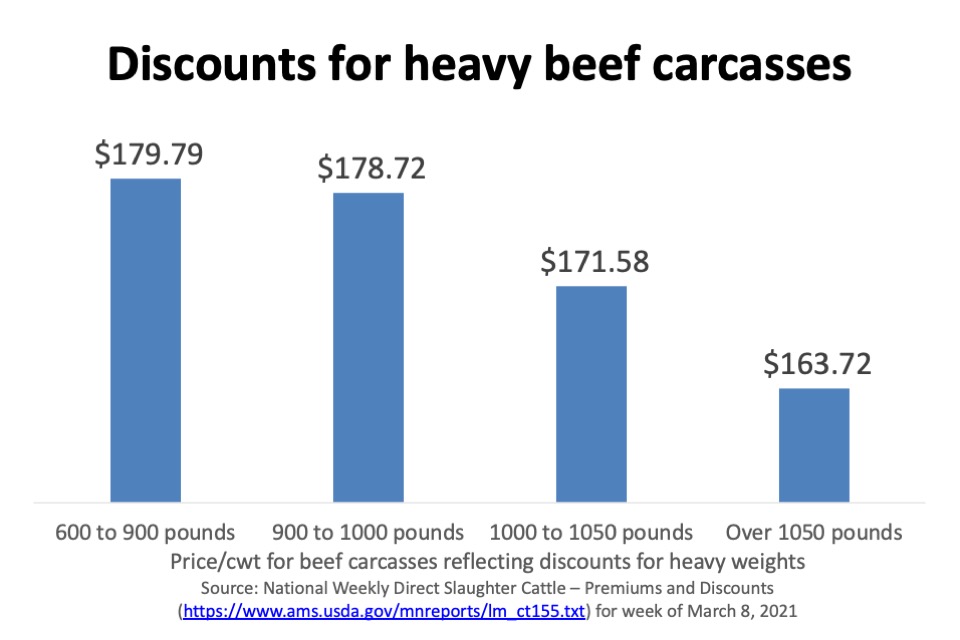
Weight
As animals increase in weight:
- Their carcasses become fatter
- Their retail cuts become larger
Consumers object to both fatness and excessively large (too costly/unit serving) cuts.
Sex
Sexes differ in:
- Dressing percentages
- Carcass proportions
- Cutability
- Palatability
- Acceptability
These differences are the result of age at marketing versus age at puberty.
- Beef —> market at 18 months, puberty at 12 months
- Swine —> market at 7 months, puberty at 7 months
- Sheep —> market at 8 months (Spring lamb) or at 14 months (old crop lamb), puberty at 8 months
Effect of sex-class on various traits of beef, swine, and sheep
| Trait | Beef | Swine | Sheep |
|---|---|---|---|
| Dressing percentage | Decrease 4 to 10 percentage points (heifers, due to pregnancy; bulls, due to heavier hides, heads, etc.) | No effect | Decrease 4 to 10 percentage points in old crop lambs |
| Carcass proportions | Chuck +2% in bulls; flank +2% in heifers | No effect | Shoulder +3% in old crop lambs |
| Cutability | Bullock > steer > heifer | Boar > gilt > barrow | Ram > wether = ewe lamb in spring lambs; ram > wether > ewe in old crop lambs |
| Palatability | Bullock (tenderness) | Boar (boar odor) | Ram (flavor) |
| Acceptability | Class designation "Bullock" | No effect | Ewes may have class designation of "yearling mutton" |
Net effects —> intact males and females are usually priced lower than the castrated males of the species (with the exception of swine)
Fatness
Contributes:
- Firmness and appearance to cuts
- Retards cooler shrink
- Retards cooking shrink
- Contributes to palatability
Fat is deposited in the following sequence:
- Mesenteric
- Kidney
- Intermuscular
- Subcutaneous
- Intramuscular
Mesenteric, kidney and intermuscular fat contribute little to firmness and appearance, retarding shrink and to palatability, but subcutaneous and intramuscular fat do.

Correlation of subcutaneous fat to marbling is .24 (explains about 5.8% of the variation).
Source: Boykin et al. (2017); J. Anim. Sci. 95: 3003-3011; doi: 10.2527/jas.2017.1544)
Because of the relationship between red (Type 1) versus white (Table IIB) muscle fibers and fatness-muscling, it is difficult to select for very muscular animals that marble.
Breeds with superior ability to deposit marbling
Duroc
Southdown
Angus
Breeds with inferior ability to deposit marbling
Yorkshire
Merino
Limousin
Predominately red (Type I) fibers —> Angus, Jersey, Longhorn, Shorthorn
Predominately white (Type IIB) fibers —> Charolais, Limousin, Maine Anjou, Gelbvieh
Marbling plays an important role in the price of beef. A large portion of this price deals with supply/demand. The above chart demonstrates that small changes in intramuscular fat can have a great impact on the price of beef subprimals.

Price/cwt for Choice steer carcasses that vary in USDA yield grade
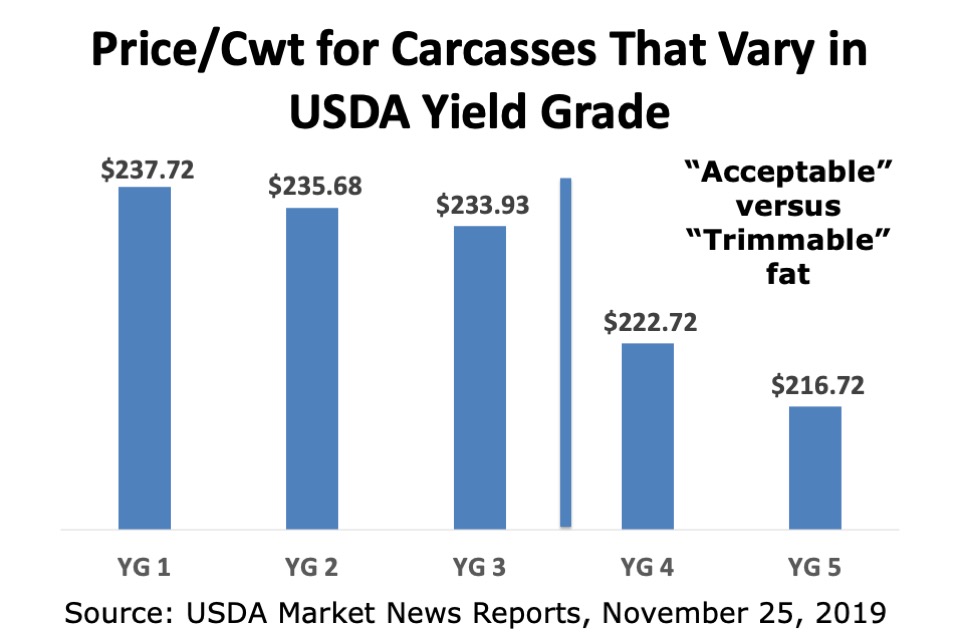
In market animals, we require a certain quantity of subcutaneous fat (termed acceptable), but we grossly penalize that fat that is considered in excess (termed trimmable). In today’s market, we sort carcasses into groups of “Y 3’s or better,” “Y 4’s” and “Y 5’s” because the trim level we consider acceptable is 1 inch or less. As trim levels decrease over the years, the line for acceptability will likely shift to the left.
Muscling
Growth gradients for muscling:
(1) Starts at extremities (forelimbs and hindlimbs)
(2) Moves upward (chuck and round)
(3) Progresses forward from rump and backward from withers
(4) Meets at rib-loin juncture
Theories regarding muscling
(1) That long-bodied, tall stretchy animals are more muscular and/or yield higher percentages of steaks from certain areas of the carcass.
(2) That you can select for heavy muscling in the loin and/or round (or leg or ham) and select against muscling in the chuck or shoulder.
(3) That muscle is always present in constant ratio and proportion to bone.
(1) That long-bodied, tall stretchy animals are more muscular and/or yield higher percentages of steaks from certain areas of the carcass.
False!
With increased length of loin and rib sections, the flank and plate sections are longer, too. Thus, no net effect from a percentage standpoint.
(2) That you can select for heavy muscling in the loin and/or round (or leg or ham) and select against muscling in the chuck or shoulder.
False!
Muscles grow in concert. Thus, as you select for increased muscle in the round, muscles in the chuck will also increase.
“Expensive Muscle Group” makes up 56% of total muscle weight of cattle of very different shapes and appearance (Butterfield and Berg).
(3) That muscle is always present in constant ratio and proportion to bone
False!
Muscle:Bone
Thinly muscled 2.5:1
Normally muscled 3.5:1
Thickly muscled 4.5:1
Double muscled 5.5-8.5:1
Effect of cattle type on the ratio of major cuts (1/2-inch external fat trim) to bone: Steers
| English | Exotic | Holstein | < 50% Bos indicus | ≥ 50% Bos indicus | |
|---|---|---|---|---|---|
| Major cuts, % | 46.32 | 46.73 | 46.00 | 46.90 | 47.70 |
| Bone, % | 15.68 | 16.04 | 19.17 | 16.56 | 15.97 |
| MC:B | 2.95 | 2.91 | 2.40 | 2.83 | 2.95 |
Effect of cattle type on the ratio of major cuts (1/2-inch external fat trim) to bone: Heifers
| English | Exotic | < 50% Bos indicus | |
|---|---|---|---|
| Major cuts, % | 46.19 | 46.64 | 45.70 |
| Bone, % | 14.43 | 14.91 | 14.95 |
| MC:B | 3.20 | 3.13 | 3.06 |
Muscling —> ratio of total muscle to total bone
Leanness —> Ratio of total muscle to total fat
Meatiness —> Ratio of total muscle plus acceptable fat to total bone plus trimmable fat
Review of Material — What the student should know:
(1) The reason why different prices are paid for different products.
(2) Concepts related to what happens to animals when they get older, heavier, are from different sex-classes, are fat or are heavy or light muscled.